This entry is part of the JTMS Management Company blog — the journal for our internal private investment fund (PIF). It documents a completed short-term trade from original thesis through monthly updates and final exit, shared for transparency and education.
Original Thesis
As CIO of JTMS Management Company, I’ve always been a strong believer in Tesla and Elon Musk’s long-term vision. I have no doubt that TSLA is positioned for significant growth over the coming decade as electric vehicles, autonomy, and energy storage continue to scale.
However, trading is not about “forever.” It’s about managing the here and now. Looking at the five-year chart, a clear repeating pattern of peaks and bottoms has emerged. This is why JTMS Management Company initiated a bearish short-term position on TSLA — to capitalize on the next expected pullback while still remaining long-term constructive on the company.
The Pattern We’re Watching
Don’t get me wrong — this isn’t a knock on Tesla’s fundamentals. It’s about recognizing recurring trends in the stock’s behavior. When I pull up the extended chart (below for reference), it’s like staring at a roadmap of ups and downs. The green arrows highlight the peaks, while the red ones mark the bottoms. Historically, each peak-to-bottom cycle hasn’t dragged on longer than about eight months. The last bottom (arrow 4) hit around seven months ago, and my analysis suggests the recent high (arrow 5) could be setting up for another downturn. Our approach at JTMS has been informed by such patterns over the past couple of years, but we’re not betting everything here — we’ve implemented a 50% stop-loss to manage risk and exit if the trade moves against us.
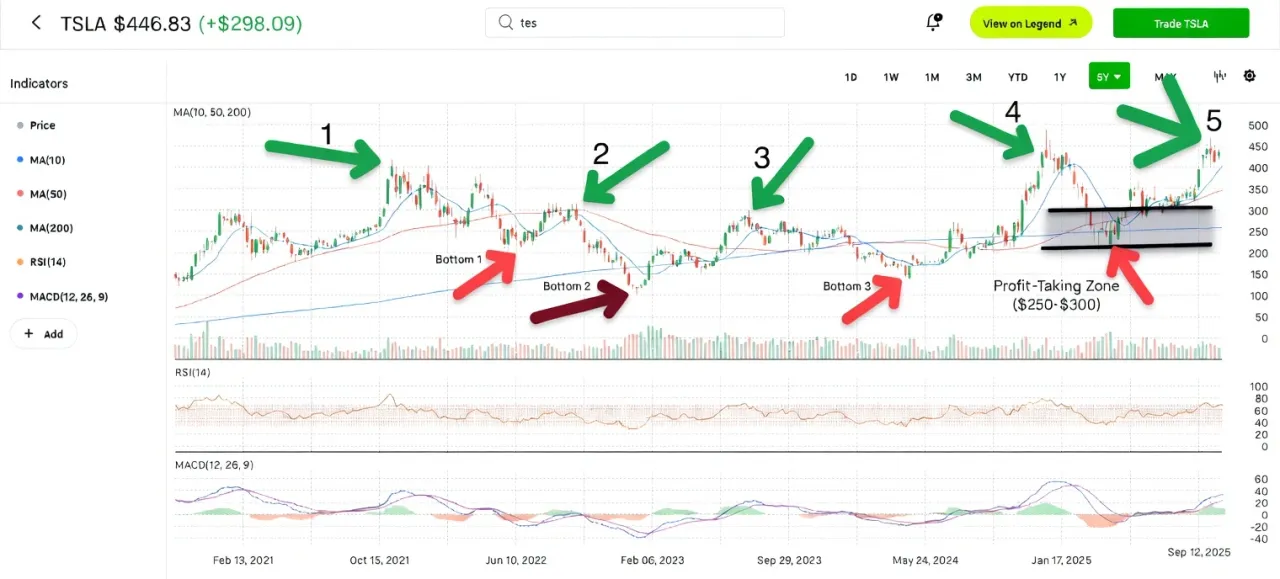
Take arrow 3, for instance — that was the last major peak at about $488, eerily close to where we were sitting at entry. It’s possible TSLA pushes a bit higher, maybe even to $500, before any potential reversal. But based on the pattern, I anticipate the next bottom could form around April or May 2026. As Mark Douglas puts it in one of my favorite reads, Trading in the Zone: “The market generates behavior patterns, and the patterns repeat themselves, but not every time.” At JTMS, we focus on identifying these setups and maintaining discipline in our execution. It’s challenging to go against prevailing sentiment, but that’s often where opportunities arise — provided you prioritize risk management.
On the price side, those peak-to-bottom drops have typically ranged from $150 to $200 per share, with one outlier jumping $300 (from arrow 2 to 3). We’ve marked a “profit-taking zone” on the chart with two black lines, targeting a potential drop to between $250 and $300. Our plan: exit half the position at $300 and the rest at $250, if conditions align. If market dynamics shift — due to unexpected news or broader trends — we’ll reassess and document any changes transparently in our updates. Flexibility is important, but so is adhering to a structured approach.
Trade Structure
We opened a May 2026 $470 put option. Our plan was simple and rules-based:
- Exit half the position near $300
- Exit the remaining half near $250
- Maintain a 50% stop-loss to protect capital if the thesis proved incorrect
This post was written the same week the trade was initiated (week of October 23, 2025) and marked the beginning of a new transparency initiative: monthly updates on select trades so readers can follow the process in real time.
Monthly Updates
Update 1 – Week of November 19, 2025
Tesla dipped below $400, generating a meaningful unrealized gain on the May 2026 $470 puts. We remained well above our profit-taking zone and maintained the full position with the 50% stop-loss in place.
Update 2 – Week of December 19, 2025
TSLA rebounded to approximately $472, putting the position into a modest unrealized loss. The 50% stop-loss was not triggered. We continued to hold, viewing the move as potential noise within the larger pattern.
Update 3 – Week of January 19, 2026
TSLA traded around $420. We returned to unrealized profit. Despite positive news flow around Full Self-Driving and Optimus, we stayed disciplined and held the position based on the original chart pattern thesis.
Update 4 – Week of February 19, 2026
The stock opened near $405, dipped to $395, then rebounded toward $417. The put remained in unrealized profit. We continued holding with the stop-loss intact.
Final Update – Week of March 23, 2026
We closed the entire position on the morning of March 23 when TSLA traded near $360. The May 2026 $470 put options were sold, locking in the gains.

Although our original profit zone was $250–$300, as expiration approached and the stock reached $360, we decided it was a reasonable near-term low. Rather than force the deeper target, we prioritized locking in a solid profit. The trade delivered a realized return of approximately +35.5% over roughly five months.
This decision reflects a core principle we follow at JTMS: patterns provide the framework, but flexibility and risk management must come first.
Closing Thoughts
This trade was never about a permanent bearish view on Tesla. Long-term, I remain constructive on the company’s vision and potential. This was a short-term, pattern-based opportunity executed with defined risk and transparent updates.
We hope sharing the full process — from thesis to entry, monthly monitoring, and final exit — provides useful insight into how we approach these setups at JTMS Management Company.
Best Regards,
Syed I. Hussain, Chief Investment Officer, JTMS Management Company
Disclaimer: This post is a personal and company reflection on a past trade for informational and educational purposes only. It does not constitute investment advice or a recommendation to buy, sell, or hold any security. Past performance is not indicative of future results. All investments involve risk, including the potential loss of principal.